1 Basic Usage
The Distribution Panel is started in the OPI by feeding the line {DistributionPanel.open} This opens a window that displays different data on the distributed work done by the current emulator.
Keep in mind that producing and displaying the data is a memory consuming task. Do not use the Distribution Panel with too much load, or the behaviour of the entire emulator will be highly affected and the results will not be the same as without the Distribution Panel.
The Distribution panel polls information at regular intervals. Some data is accumulative, e.g. Message exchange. For this data the number of events since the last poll is displayed. This is interpreted as events per sample period. Other data is transient, e.g. Last RTT (roundtrip time). Here the last known value is plotted.
Since the distribution behavior is affected by the garbage collector a red vertical bar is inserted in all graphs when garbage collection occurs. This allows garbage collection related behaviour to be understood.
The Distribution Panel has several different frames described in detail the remaining sections of this chapter.
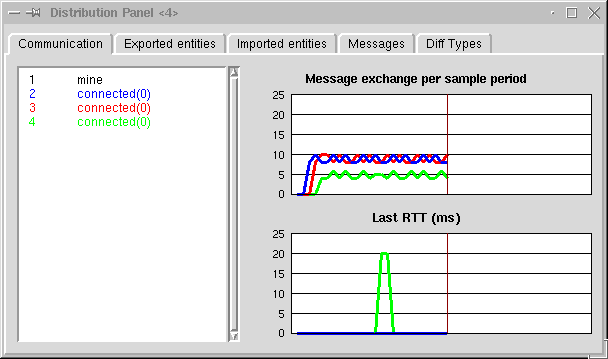
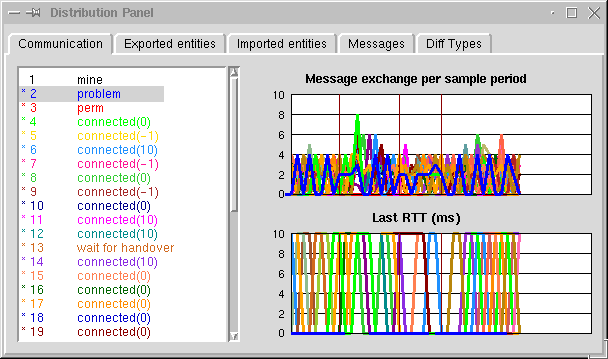
1.1 Communication
The Communication frame displays the status and history of all Mozart sites that our site currently has references too. The information is composed of a list of all sites to the left and to graphs displaying the history of communication to and from each site.
1.1.1 Site list
In the list to the left, each site is numbered and given a separate color. By left clicking the site a detailed description of the site is shown in the browser. This contains the ip address, accepting port and the process id plus some more information. The output is taken from DPStatistics as defined in Chapter 19 of ``System Modules''. An extra field, traffic shows the accumulated messagecounts.
The current state of the site is also printed in the site list. There is allways one site present with 'state' mine. That is a placeholder for the site representing the current emulator. The state of the other sites can be the following:
- connected(N)
A connection is established and the last measured round trip time to that site was N.
- perm
The site is permanently down.
- passive or closed
A reference is present but the emulator is currently not connected to that site since there is no need for communication.
- problem
There is no connection and there is some problem. It could be that it isn't possible to open a connection or that the connection was unexpectedly closed.
- wait for handover, wait for remote, presentation or negotiate
A connection is requested or is being initialized. Wait for handover means the local engine has been ordered to connect. Wait for remote means the remote site is responsible of reconnecting. Presentation and negotiate is part of an initialization phase.
- closing (hard), closing (weak) or wait for disconnect
The connection is being closed. A hard close is due to lack of resources and will be reopened as soon as possible. A weak close is due to garbage collection when there is no need for the connection. Wait for disconnect is a passive wait for the remote party to close the channel.
1.1.2 Graphs
In the two graphs, the colors of the site list are used to show the communication between this site and each remote one.
Message exchange per sample period shows how many messages have been sent or received since the last poll for data.
Last RTT (ms) shows the last measured Round Trip Time at each poll for data. The RTT is defined as the time between when a message is transferred and when its acknowledgement is received back. This value includes the network RTT as well as any delays due to ongoing local or remote computation.
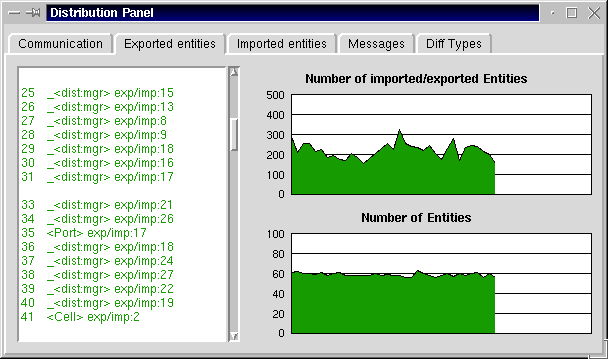
1.2 Exported Entities
The Exported Entities frame shows all entities that the current site has currently exported to the other sites. Notice that entities exported by the Connection module do not show up as exported until they are taken by another site.
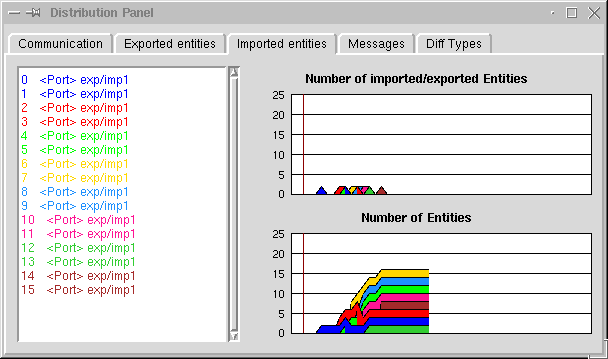
Number of imported/exported Entities shows how many times a reference to any exported entity has been sent or received by this site.
Number of Entities shows how many entities are currently exported.
1.3 Imported Entities
The Imported Entities frame dipslays all entities currently imported to this site. The entities are colored with their origin site's color (see 1.1).
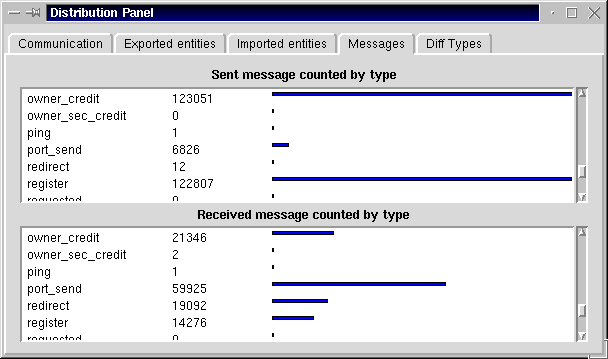
1.4 Message Statistics
The Message Statistics frame shows the total number of sent and received messages per message type. The Message type is the internal type used by the Message Passing Layer and the entity protocolls.
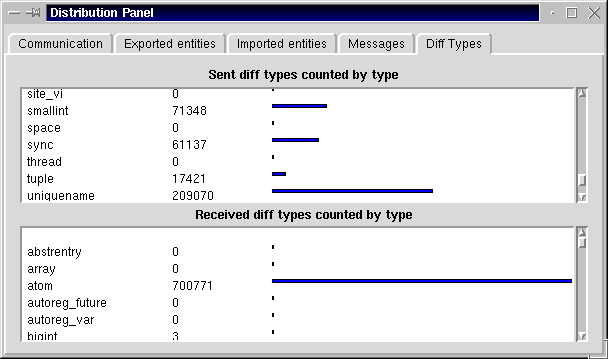
1.5 Diff type Statistics
The Diff type Statistics shows the total number of imported and exported Mozart data structures.