3 Ozcar's User Interface
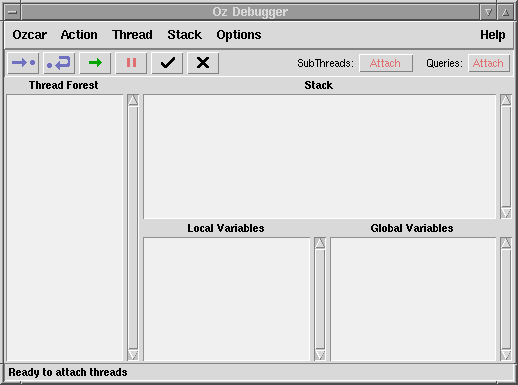
Ozcar's main window, depicted in Picture 3.1 as it appears when Ozcar is first invoked, displays a number of views: the Thread Forest View, the Stack View, and the Environment Views. Below these is the Status Line, and Emacs serves as the Source View. In the following, each of these elements of Ozcar's user interface will be described.
3.1 Thread Forest View
The pane on the left, labeled Thread Forest, gives an overview of all currently attached threads. The fact that every thread has been created by some other thread (its parent) defines a tree-shaped relation between threads. The attached threads form a number of partial subtrees of the whole thread hierarchy - this is why we refer to this view as a thread forest. The way threads are displayed reflects this tree structure: Children are inserted below their parent and indented to the right.
Thread IDs
For the purpose of debugging, threads are assigned integer IDs internally. These IDs do not carry any semantic significance and are only used to allow easier recognition of individual threads by the user, as well as to construct the tree representation. Note however that thread IDs need not be unique. In the thread forest, each thread node is depicted by the textual representation of its ID. (In the case of distributed debugging, the remote site's node name and process ID are also included.)
Thread States
The color of each node in the thread forest reflects the corresponding thread's state, similar to what the Thread.state operation returns:
- green: runnable
The thread's computation can proceed.
- yellow: blocked
The thread waits for a synchronization condition, i. e., it currently cannot proceed.
- gray: terminated
The thread is dead.
- red: crashed
The thread died of an exception it did not handle.
Stopped Threads
For the purpose of debugging, thread state actually has an additional dimension, namely whether the thread has currently been stopped by the debugger or not. This is reflected by a normal font (thread is stopped) or a bold font (thread is running), respectively.
Selected Thread
If at least one thread is attached, then one thread will always be the selected thread; its node is marked with an asterisk. This is the thread that thread actions operate on, and whose information is displayed in the other views. You can select a thread by clicking its node with the left mouse button, or you can navigate in the thread forest using the left and right cursor keys.
3.2 Stack View
Stack Frames
On the top right, the pane labeled Stack or Stack of Thread id displays the stack of the currently selected thread. The stack is a sequence of frames, where each frame describes a nested construct or procedure activation. The stack provides a trace of how the computation reached its current point of execution; the latter is called the topmost frame.
Stack Display
The Stack View displays the stack as one line of text per frame, where the first entry corresponds to the oldest activation frame and the last entry to the most recent frame (the topmost one). Each line consists of three columns. The first column contains an arrow indicating whether control is at the entry (right arrow) or at the exit of the corresponding nested construct, the second column gives the number of the stack frame, and the third column a description. The description may contain arguments (values), printed in bold face, which can be clicked on for examination with the Inspector.
Selected Frame
Some debugging actions refer to specific stack frames. To this purpose, stack frames can be clicked (in a place not displaying a value) to become the selected frame. The selected frame is indicated by a blue background. The up and down cursor keys also permit navigation through the stack.
Disabled Stacks
When the selected thread is running, its stack is grayed out to indicate that it is out of date, but contained values will still react to clicks.
3.3 Environment Views
Below the Stack View, there are two panes labeled Local Variables and Global Variables, displaying the values of local and global variables of the selected stack frame (or the topmost frame if no frame is selected). The variables of the local environment are sorted by order of introduction in the source code; the global environment is sorted alphabetically. Clicking the values causes them to be inspected.
3.4 Status Line
The Status Line at the bottom of the main window provides feedback about actions performed and the current state of the debugger.
3.5 Source View
The Source View is not located within Ozcar's main window; instead, Emacs is instructed to display the source position corresponding to any selected frame.
Color Coding
Emacs highlights the line of source code corresponding to the selected frame in a color reflecting the selected thread's state: When the thread is running, highlighting will be done in gray; when it is stopped, in blue; and when the thread died of an exception or stopped at a breakpoint, in red.
