6.2 Example: Drawing Bar Charts
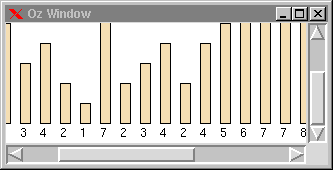
As a more interesting example let us consider a program to draw bar charts. The definition of a class to display barcharts is shown in Figure 6.1. Before any item is created in the canvas by the method bars, the canvas widget is configured such that the scrollable region is just large enough for the barchart to be drawn.
local
   O=if Tk.isColor then o(fill:wheat)
     else               o(stipple:gray50 fill:black)
     end
   D=10  D2=2*D B=10
in
   class BarCanvas from Tk.canvas
      meth DrawBars(Ys H X)
         case Ys of nil then skip
         [] Y|Yr then
            {self tk(create rectangle X H X+D H-Y*D2 O)}
            {self tk(create text      X H+D text:Y anchor:w)}
            {self DrawBars(Yr H X+D2)}
         end
      end
      meth configure(SX SY)
         {self tk(configure scrollregion:q(B ~B SX+B SY+B))}
      end
      meth bars(Ys)
         WY=D2*({Length Ys}+1) HY=D2*({FoldL Ys Max 0}+1)
      in
         {self configure(WY HY)}
         {self DrawBars(Ys HY D)}
      end
   end
end
Figure 6.1: A canvas for displaying bar charts.
The method DrawBars creates for each element of the list Ys a rectangle item as well as a text item, which both correspond to the value of the particular item. The value of O is used as option for the rectangle items. This value depends on Tk.isColor which is true if the screen is a color screen, and false otherwise. For a color screen the rectangle items are filled with the color wheat. For a black and white screen, the rectangle items are drawn in a stippled fashion: only those pixels are drawn with the fill color (that is black) where the stipple bitmap contains a pixel.
Figure 6.2 shows how the bar chart canvas is used in order to display data.

C={New BarCanvas    tkInit(parent:W bg:white width:300 height:120)}
H={New Tk.scrollbar tkInit(parent:W orient:horizontal)}
V={New Tk.scrollbar tkInit(parent:W orient:vertical)}
{Tk.addXScrollbar C H} {Tk.addYScrollbar C V}
{Tk.batch [grid(C row:0 column:0)
           grid(H row:1 column:0 sticky:we)
           grid(V row:0 column:1 sticky:ns)]}
{C bars([1 3 4 5 3 4 2 1 7 2 3 4 2 4
         5 6 7 7 8 4 3 5 6 7 7 8 4 3])}
Figure 6.2: Using a canvas for drawing barcharts.